Data was scattered across systems and sites: making AI the unified decision entry point for its users.
Advantech iEMS had already collected water, electricity, gas, and equipment data, yet both of its user groups — facility staff and system integrators (SIs) — were still handed raw data: EcoWatch, HVAC, and different sites operated separately, and risk judgment relied on stitched-together experience. Starting from how these two groups make decisions, I reframed AI from passive Q&A into a cross-system entry point that retrieves data, carries context proactively, and extends into long-term reporting and machine panels.
The system collected the data but did not help users or the business make decisions.
Business stakeholders: managing risk across systems and sites
EcoWatch, HVAC, and different plants accumulated data separately, leaving the business without a unified entry point for comparing equipment and energy risks. Even with complete data, managers still struggled to decide which issue to address first.
Facility staff: the people using the system every day
A single machine using 20% more energy disappeared among hundreds of meters in the overview; new staff spent 3+ hours a day learning the system, and anomaly judgment still leaned on senior technicians' experience — which is hard to hand over.
System integrators (SI): the people deploying it for customers
SIs use this system to advise customers on energy, but it returns raw data with no recommendations — questions like “how much can we save, which machine goes first” had no answer, and one customer unfamiliar with demand rules paid NT$3M a year in overage penalties.
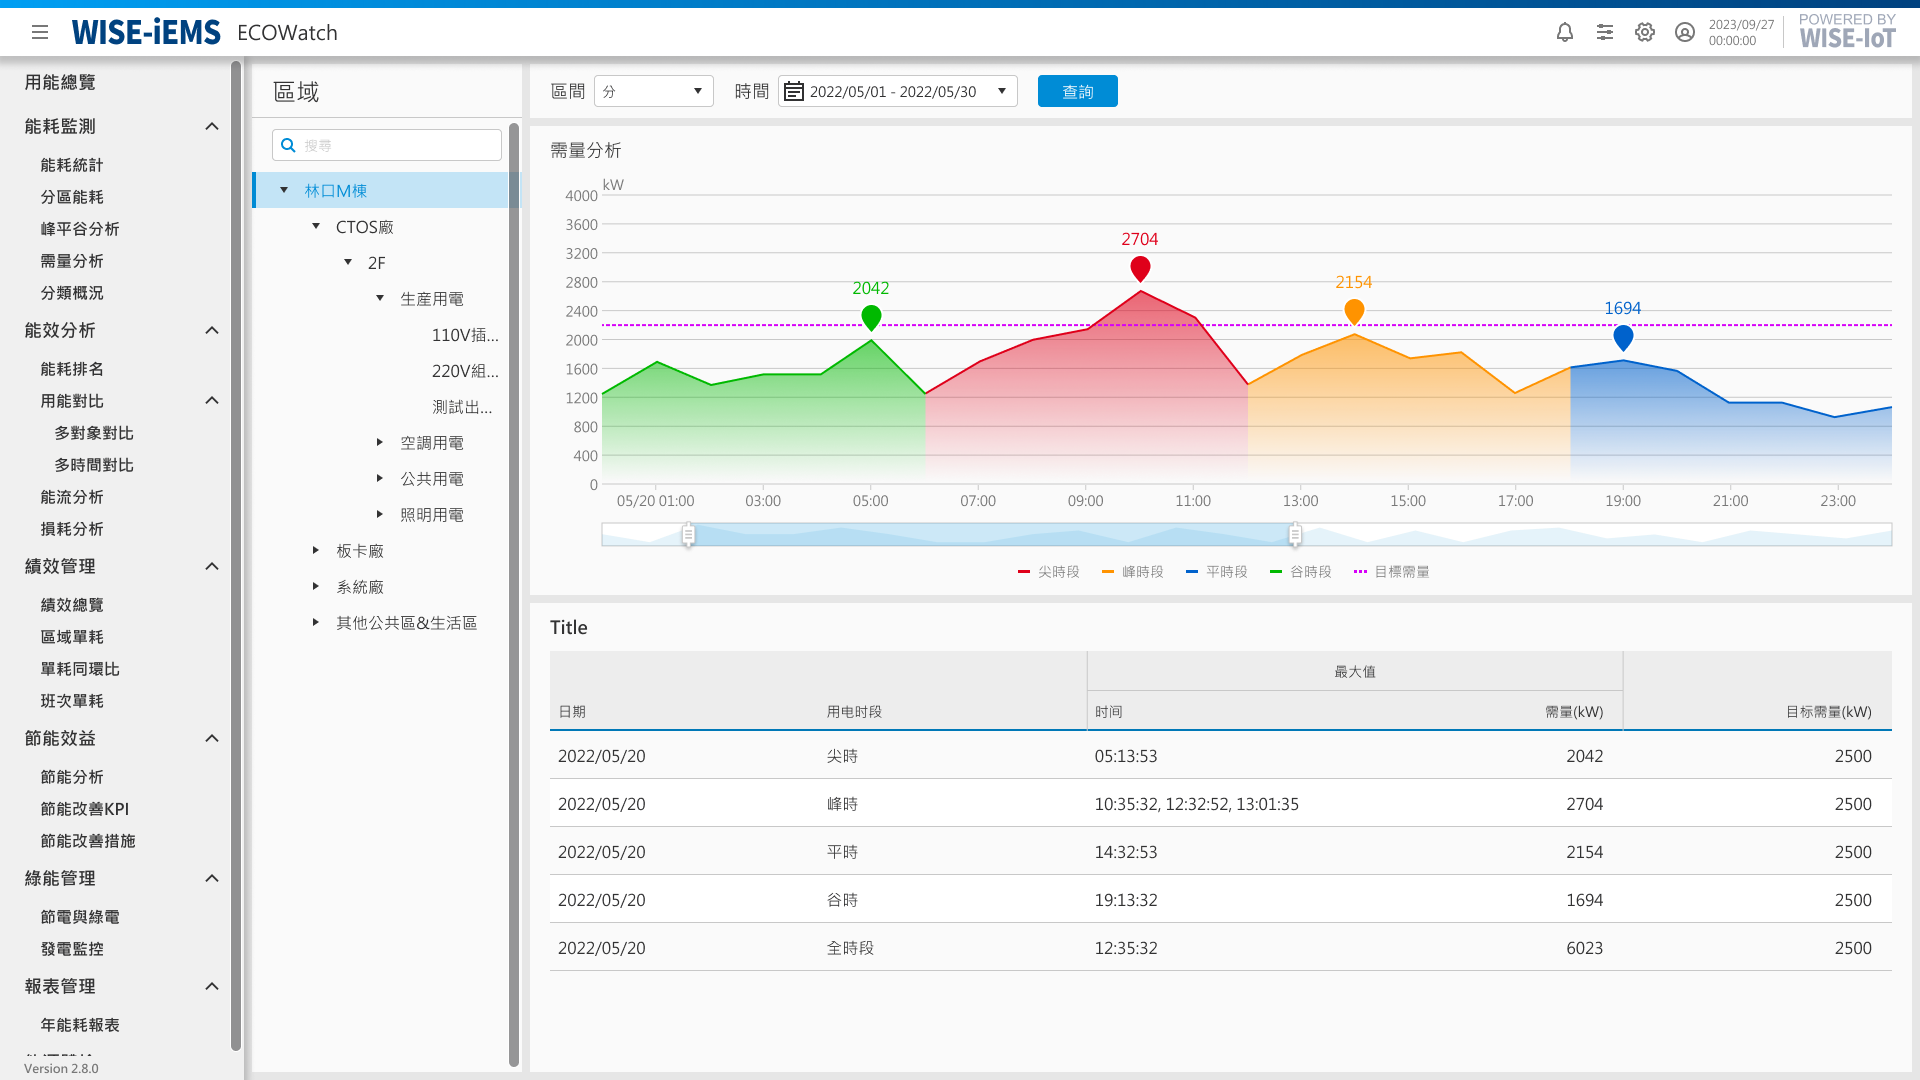
Existing EcoWatch demand analysis: the data was complete, but interpretation still relied on user experience.
Outcome walkthrough
From demand analysis and overage alerts to equipment anomalies, AI gives every risk a clear next step.
Step 01
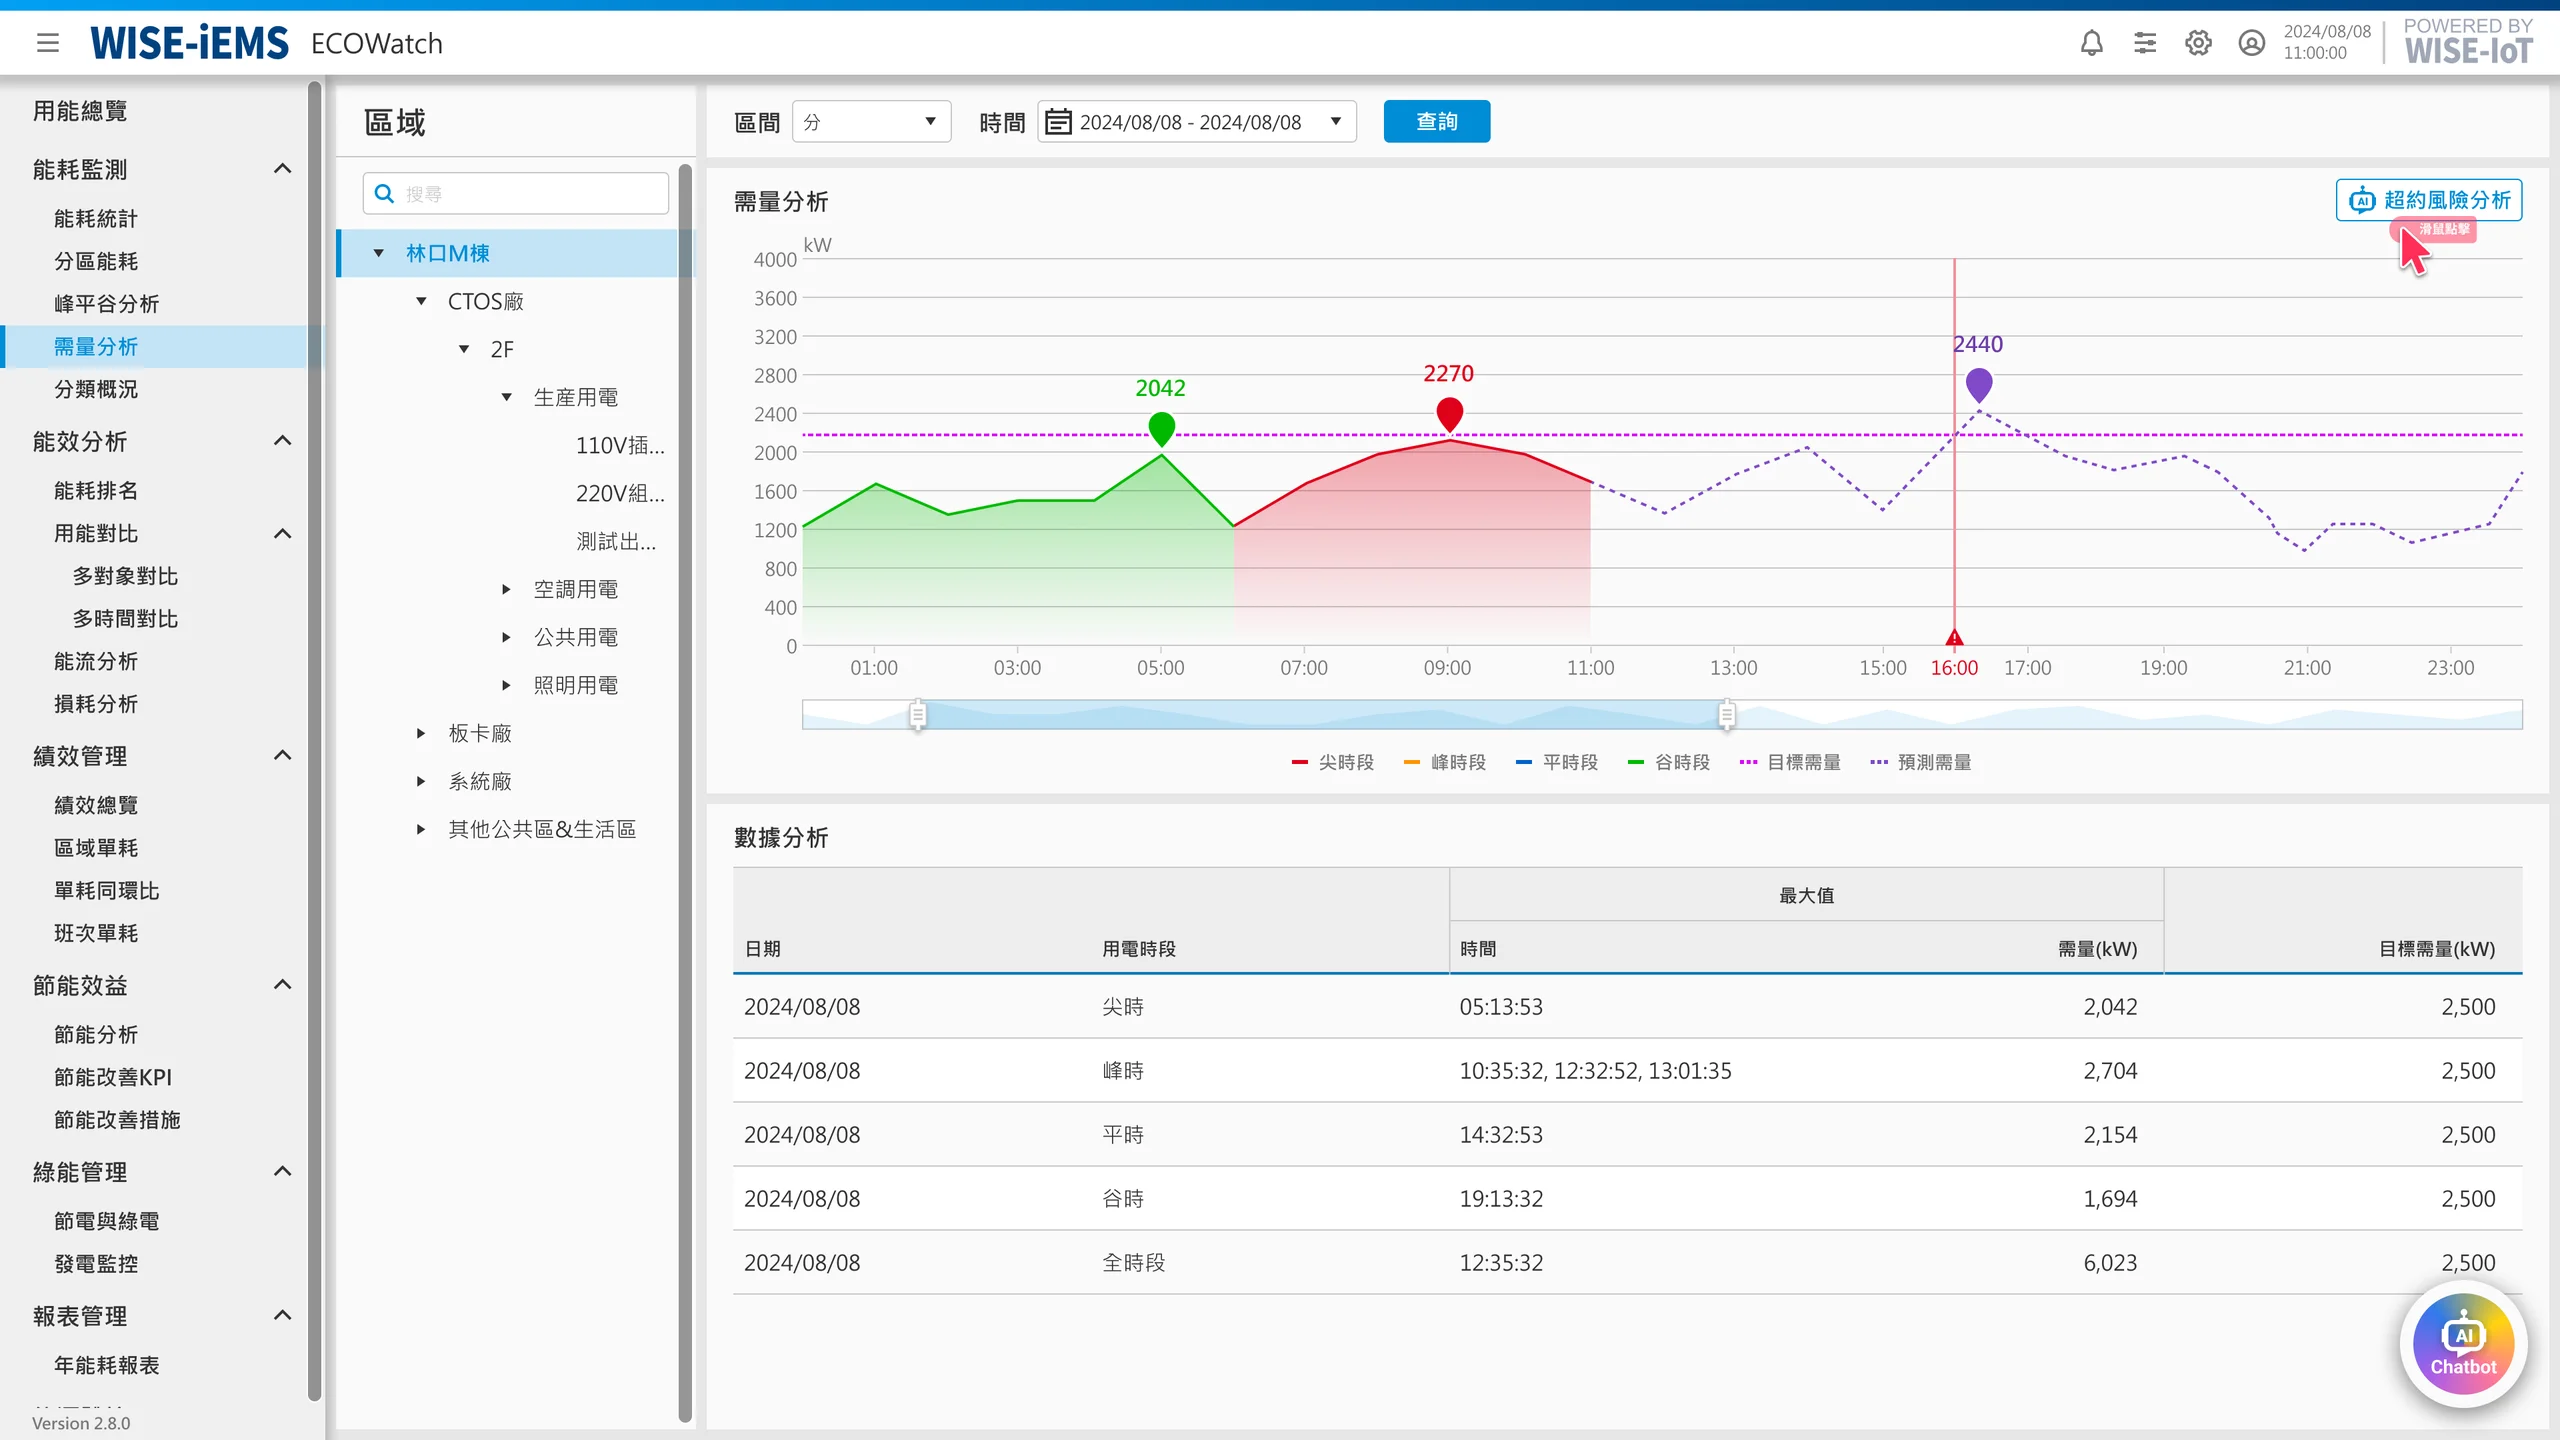
The user clicks “Overage alert” on the demand page, and the interface passes time and location context automatically with no typing needed.
PRODUCT CONTEXT
Understanding the ECOWatch and HVAC modules behind the chatbot.
The project centered on two energy-management modules within Advantech's WISE-IoT platform. ECOWatch visualizes building energy use in real time, while WISE iEMS HVAC applies AI algorithms to proactively optimize HVAC efficiency. Together, they form the core of the smart facility-management solution that the AI chatbot was designed to connect.
ECOWatch
Monitors real-time usage of water, electricity, gas, and heat while combining submetering, energy analysis, alerts, and automated reports. It helps facility managers understand energy consumption comprehensively, achieving average energy savings of 3–10% and reducing manual inspection time by 80%.
Energy MonitoringReal-time AlertsSubmeteringAutomated Reports
HVAC
Combines AI algorithms, IoT sensing, and digital-twin technology to monitor HVAC performance and detect anomalies in real time. Multidimensional analysis proactively optimizes operating strategies to reduce energy use and cost.
AI OptimizationAnomaly DetectionEfficiency DiagnosticsStrategy Optimization
MY ROLE
Defining scope, research, and prototypes across the AI-chatbot workflow.
01
Define Goals and Design Scope
Aligned project goals with the PM and clarified the design scope and priorities so the AI chatbot addressed real facility-management workflows.
02
Competitive Analysis
Researched competitor features, designed interview guides, and translated energy-management and maintenance pain points into design opportunities.
03
User Interviews and Team Workshop
Synthesized interview findings and participated in team workshops to connect user needs and pain points with project goals.
04
Feature Design and Prototyping
Designed overage alerts and pattern-recognition features, including wireframes, interaction flows, prototypes, and video storyboards for stakeholder alignment.
DESIGN PROCESS
Turning research insights into an AI-chatbot interface.
↔Swipe to see more
01
Project Kickoff and Framework
Established project goals, scope, timeline, and the chatbot's core design priorities.
03
User Interviews and Insight Synthesis
Interviewed target users to uncover needs, behaviors, and pain points that informed the design.
05
Prototyping and Interaction Flows
Built interactive prototypes and collaborated with engineers to ensure GenAI feasibility.
02
Competitive Analysis
Studied existing AI products to identify market trends, differentiation, and design opportunities.
04
Wireframes and Interface Design
Designed chatbot wireframes and defined the information architecture and core interaction flows.
06
Interaction Demo Videos
Created videos to communicate the final experience and align stakeholders and development.
ANALYSIS
Finding GenAI chatbot opportunities across AI tools and EMS competitors.
By comparing industry AI tools, energy-management competitors, and AI feature modules, we reframed the chatbot from a search entry point into a workflow interface that helps users identify issues, diagnose anomalies, and make energy-saving decisions.
01 / Interaction Patterns from Industry AI Tools
Four industry AI tools revealed reusable interaction patterns: summaries, insights, recommendations, and alerts. These capabilities can support data understanding and proactive reminders in energy-management workflows.
Tableau Pulse
Builds predictive machine-learning models without code, reducing reliance on data-science teams.
Insights Beside Charts
Power BI Copilot
Automatically summarizes reports, pages, and visualizations so users grasp key information quickly.
Chart-data Summaries in Conversation
Salesforce Einstein GPT
Provides personalized recommendations from user data and business needs and supports follow-up.
Recommended Action Plans Beside Charts
PagerDuty AIOps
Integrates monitoring systems and automates alert notifications for real-time response.
Automated Alert Notifications
02 / Energy and Equipment Management Competitors
Energy-management systems are increasingly combining equipment monitoring, energy analysis, cost optimization, and AI insights within a single workflow.
IBM Maximo Energy Optimization
Equipment / Energy Management
A unified energy and asset-management platform focused on remote visibility and deep insights.
Combines equipment monitoring, data analysis, remote visibility, and conversational AI for data retrieval and visual reports.
ABB Ability Energy and Asset Manager
Equipment Management
Optimizes asset performance, extends equipment life, and reduces downtime and cost.
Senseye predictive maintenance finds similar historical cases to support equipment assessment and maintenance decisions.
Schneider EcoStruxure Resource Advisor
Energy Management
Supports flexible metrics, scalability, platform interoperability, and budget monitoring.
Resource Advisor / Efficiency AI generates visual reports and energy insights.
Siemens EnergyIP
Energy Management
Centers on energy-data management and cost optimization to support energy decisions.
Proactively optimizes building HVAC efficiency and reduces electricity costs.
03 / AI Feature Comparison and Design Opportunities
Comparing Advantech's existing capabilities with market competitors revealed opportunities for further development.
↔Swipe to see more
Management Module
Existing WISE iEMS AI Features
Competitor EMS AI Features
Opportunity Areas
Equipment Management
Summarize equipment data conversationally to understand operating patterns
Recommend maintenance from equipment manuals when anomalies occur
Proactively communicate maintenance guidance and equipment context
Optimize asset performance: HVAC systems proactively recommend cost-saving plans
Analyze equipment-energy anomalies and diagnose maintenance strategies from operating patterns
Equipment-energy Anomaly Analysis
Diagnose maintenance strategies from equipment operating patterns
Energy Management
Summarize energy data conversationally to understand site patterns
Summarize demand data conversationally to understand demand patterns
Proactively Develop Energy-saving Strategies
Summarize energy-audit results in tables or charts
Explain technical terms and proactively guide system use
Provide deeper energy-saving insights and monitor budgets
Optimize tariff plans by identifying energy-use patterns and analyzing feasible saving strategies
Electricity-tariff Plan Optimization
Identify energy-use patterns and analyze feasible saving strategies
USER RESEARCH
Understanding real energy and facility-management workflows through interviews.
Interviews with internal facility teams and system integrators uncovered pain points in equipment energy audits, energy analysis, and report creation, revealing where generative AI could support the iEMS workflow.
Internal Facility Team
Internal facility staff revealed real end-user needs and pain points across site operations, facility maintenance, campus services, and electromechanical equipment.
System Integrator (SI)
System integrators provided insight into common needs across machinery manufacturing and electronics validation, broadening our understanding of different deployment contexts.
Senior facility managers handle the full process from anomaly detection and repair requests to maintenance and follow-up, but many decisions still depend on personal experience and fragmented data.
Identify Equipment Anomalies
Pain Point
Alerts depend on manually configured thresholds, while energy experts or equipment vendors must periodically audit operating efficiency.
AI Opportunity
Use pattern recognition to learn historical energy data and flag anomaly hotspots
Cross-reference historical equipment energy use and environmental data
Forecast potential energy anomalies and warn users in advance
Report and Repair Equipment
Pain Point
Troubleshooting lacks a standard process, manufacturer response times are long, and local vendors may not provide maintenance support.
AI Opportunity
Recommend self-service troubleshooting to accelerate issue resolution
Proactively provide anomaly reports, likely causes, and maintenance SOPs
Quickly incorporate vendor documents and updates into standard processes
Follow-up
Pain Point
Teams must manually track and document resolutions and improvement outcomes.
AI Opportunity
Automatically generate issue records, solutions, and impact reports
Generate written event analysis and charts
02 / System Integrator: Energy-analysis Workflow
SI interviews showed that energy analysis is often blocked by data integration, limited context for interpretation, and time-consuming reporting. Without clear links between equipment and energy data, users struggle to form actionable energy-saving decisions.
Retrieve Data
Pain Point
Equipment and energy-management data are disconnected, preventing unified comparison and visualization.
AI Opportunity
Connect Energy Use with Equipment Status
Combine production and weather data to assess reasonable energy use
Compare analysis results and recommend decisions based on user needs
Analyze Data
Pain Point
Limited context makes it difficult to determine whether equipment energy use is normal.
AI Opportunity
Proactive Severity-based Alerts
Manage energy baselines for individual machines and work orders
Convert expert knowledge into AI-generated recommendations
Create Reports
Pain Point
Report creation is time-consuming, and dashboard views cannot be used directly in formal reports.
AI Opportunity
Quickly Generate Reporting Drafts
Integrate numerical tools such as regression analysis
Evaluate demand and contract-capacity options to develop the best strategy
Interview Synthesis
01
Disconnected Data and Workflows
Equipment, energy, environmental, and maintenance records are fragmented, forcing users to connect them manually before diagnosing issues.
02
Decisions Depend on Experience
Anomaly interpretation, energy-saving strategies, and maintenance recommendations depend heavily on expert experience, with few reusable standard processes.
03
Outputs Are Difficult to Act On
Reports, issue records, and improvement outcomes require manual organization, increasing the cost of follow-up and decision-making.
DESIGN STRATEGY
Turning user pain points into two feasible AI scenarios.
After the research phase, the team used a workshop to prioritize features and translate user pain points into two feasible AI scenarios. Each scenario connects an underlying AI mechanism to a core feature strategy and, ultimately, the interface users interact with.
Scenario 1: Demand-management Decision Assistant
Helps users plan electricity use, anticipate demand risk, and avoid overage penalties.
↔Swipe to see more
Underlying AI Logic
Feature Strategy
UI Interface
Short-term Forecasting
Forecasts near-term demand from historical and real-time data and identifies potential overage periods.
Overage-risk Detection and Recommendations
Monitors peak load and potential overage risk in real time and recommends adjustments.
Advanced Chart Insights and AI Forecasts
Displays forecasts and risk indicators on demand charts.
Proactive Demand-overage Alerts
Proactively alerts users when demand approaches overage risk.
Long-term Forecasting
Analyzes seasonality, trends, and external factors to support next-quarter electricity planning.
Tariff and Contract-capacity Management
Evaluates tariff strategies and contract capacity to help users select the best option.
Conversational Chatbot
Provides electricity-use and contract-strategy guidance through conversation.
Proactively audits equipment energy patterns, detects anomaly hotspots, and recommends maintenance and efficiency improvements.
↔Swipe to see more
Underlying AI Logic
Feature Strategy
UI Interface
Pattern Recognition
Learns historical energy data, identifies normal operating patterns, and flags anomalies.
Energy Hotspot Analysis
Cross-references maintenance, environmental, and energy data to find anomaly sources.
Email and System Notifications
Communicates current equipment issues through email and system notifications.
Advanced Anomaly-hotspot Analysis
Uses visual charts to identify equipment anomalies.
Event Analysis
Combines maintenance and energy events to synthesize previous repairs and anomaly causes.
Efficiency Optimization Plan
Uses maintenance standards and historical cases to explain causes and recommend actions.
Conversational Chatbot
Provides equipment-maintenance guidance through conversation.
: By me
SOLUTION
Exploring, iterating, and detailing the final AI-chatbot experience.
Based on the defined scenarios, later iterations focused on interfaces that directly affect decision-making: the AI chatbot, demand-overage analysis modal, equipment-energy anomaly modal, and their charts, tables, and AI recommendations.
Ideation for Two Scenarios
We broke each scenario into core user tasks and AI intervention points, defining the entry points, notification methods, and recommendation feedback to validate.
Scenario 1
Demand-management Assistant: Overage Alerts
1 / 5
The system uses a notification bar to proactively indicate a demand anomaly.
Why It Wasn't Chosen
The existing interface and design system do not include this bar pattern, requiring a new component. It adds implementation cost and would need user validation before proving its value.
The system uses the notification icon to proactively surface an equipment-energy anomaly.
Why It Was Chosen
Facility staff currently inspect equipment manually rather than continuously monitoring dashboards. System notifications through email and SMS can alert responsible staff immediately and support targeted resolution.
Page and Component Iterations
Iterations examined whether information priorities were clear, data matched facility teams' interpretation habits, and users could move from an anomaly alert to understanding its cause and taking action with minimal effort.
Scenario 1
AI Chatbot Component
Improve the Window Width
ECOWatch and HVAC initially used a 360px default chat window. Users had to expand it to review detailed analysis, adding an unnecessary step and interrupting the experience. To improve usability, we changed the default width from 360px to 640px, matching the expanded view so users can review analysis directly and smoothly.
Refine the Demand Trend Chart
The original chart showed anomalies at a single moment, making it difficult to understand their place in the broader electricity trend or assess continued overage risk.
The revised chart became a complete demand-analysis visualization with a clearer timeline, kW units, target and forecast lines, colored off-peak, peak, and forecast periods, legends, and key values. Users can interpret risk periods and compare targets with forecasts more intuitively.
Before
360px
After
640px
Scenario 1
Overage-alert Analysis Modal
Prioritize AI Recommendations
AI recommendations originally appeared at the bottom of the modal after equipment lists and tables, making them feel secondary. We moved them to the top so users immediately see the analysis, overage causes, and recommended response.
Before
After
Improve the Forecast-analysis Layout
The original side-by-side layout forced users to compare long text with charts across the screen. We changed it to a top-down reading flow, placing the most important analysis summary first to improve hierarchy, scanning, and risk recognition.
Before
After
Improve Equipment Identification
The original table used equipment numbers that did not match how facility staff locate assets, and a list longer than ten items increased scanning time. We replaced numbers with familiar equipment codes and limited the ranking to the top ten energy consumers.
Before
After
Scenario 2
Equipment-energy Anomaly Analysis Modal
Use More Relevant Data
The original chart used historical energy data, which emphasized consumption and efficiency but did not match the data facility staff use during inspections. We switched to historical operating status, focusing on chilled- and cooling-water inlet and outlet temperatures.
Before
After
Improve the Fault History
The original fault memo was a flat table showing only one cause and response, making frequency and cause priority difficult to assess. We added AI analysis that synthesizes historical resolutions into a useful diagnostic summary.
Before
After
Interface Details for Three Final Features
The final interface connects alerts, advanced analysis, and generated recommendations so users can move from anomaly detection to action.
Feature 1.1 | On-demand Demand Analysis
Users can independently move from forecasts and overage alerts to AI recommendations, turning energy management from passive chart viewing into decision support.
Overage-risk Analysis
Marks forecast peaks, overage-risk intervals, and AI explanations on the demand curve so users quickly understand when issues may occur.
Conversational Recommendations
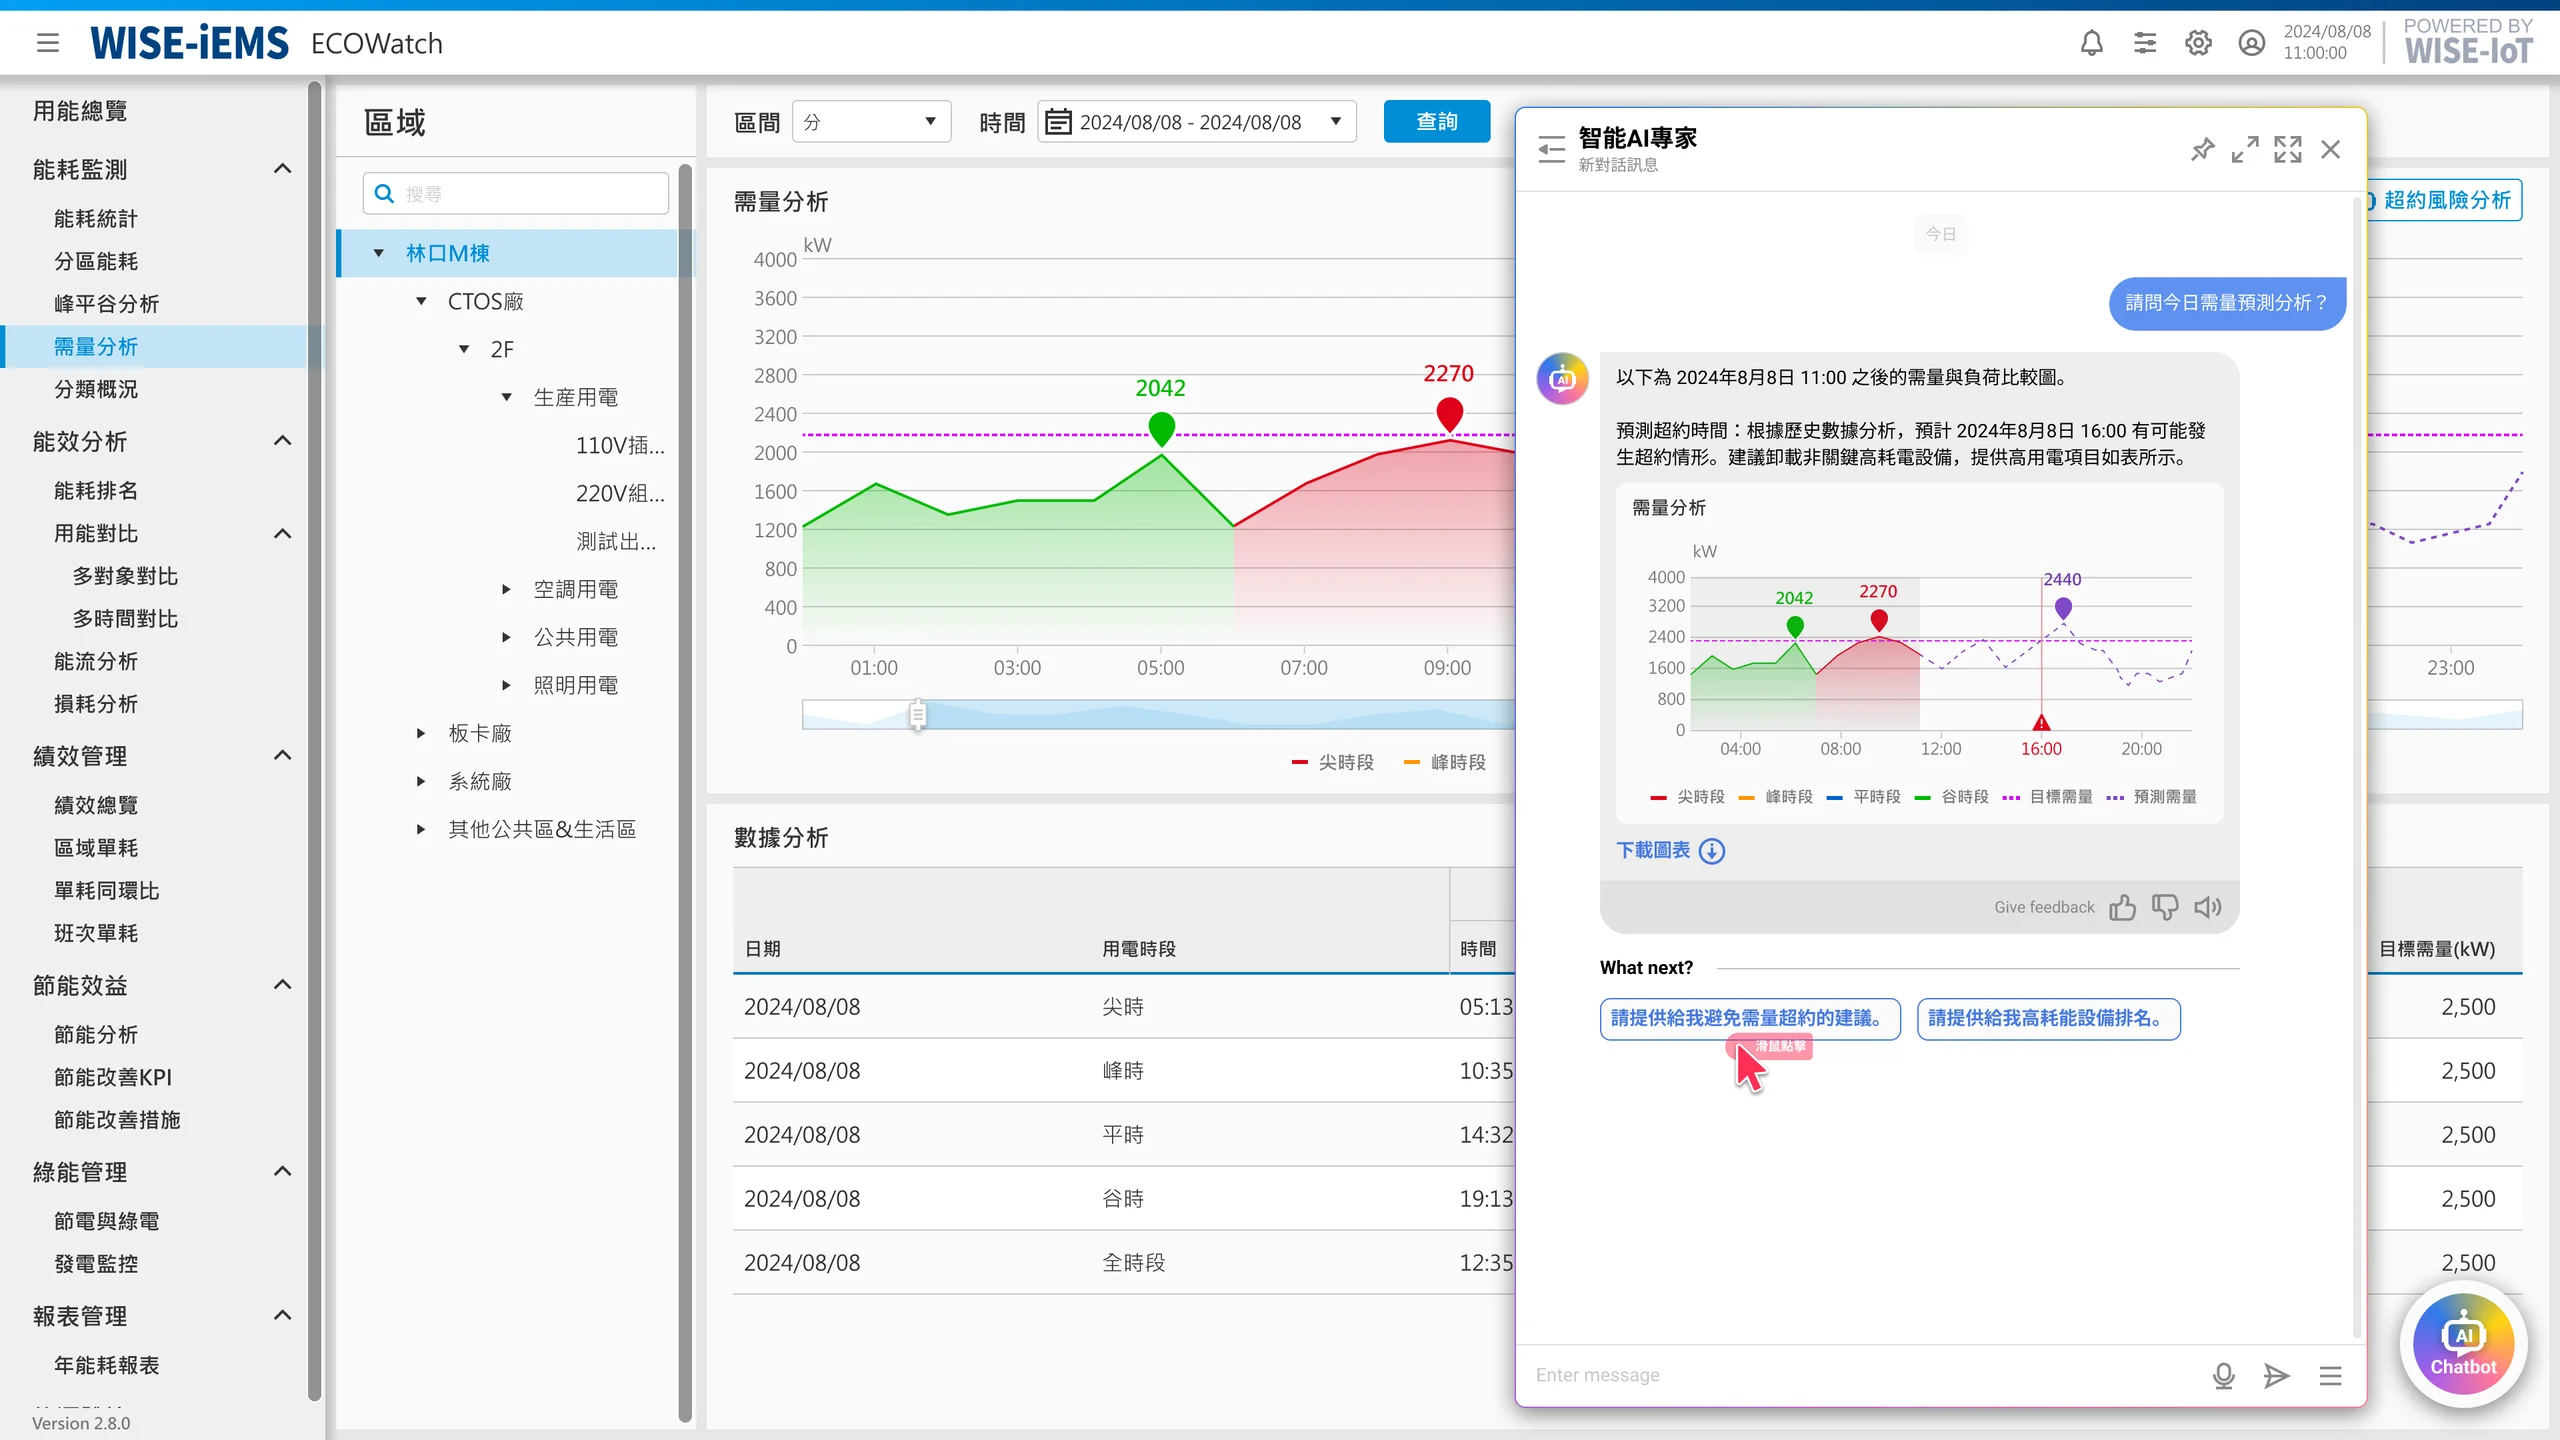
Users can ask the AI chatbot for demand forecasts, overage alerts, energy-saving recommendations, and equipment rankings to understand conditions and next actions quickly.
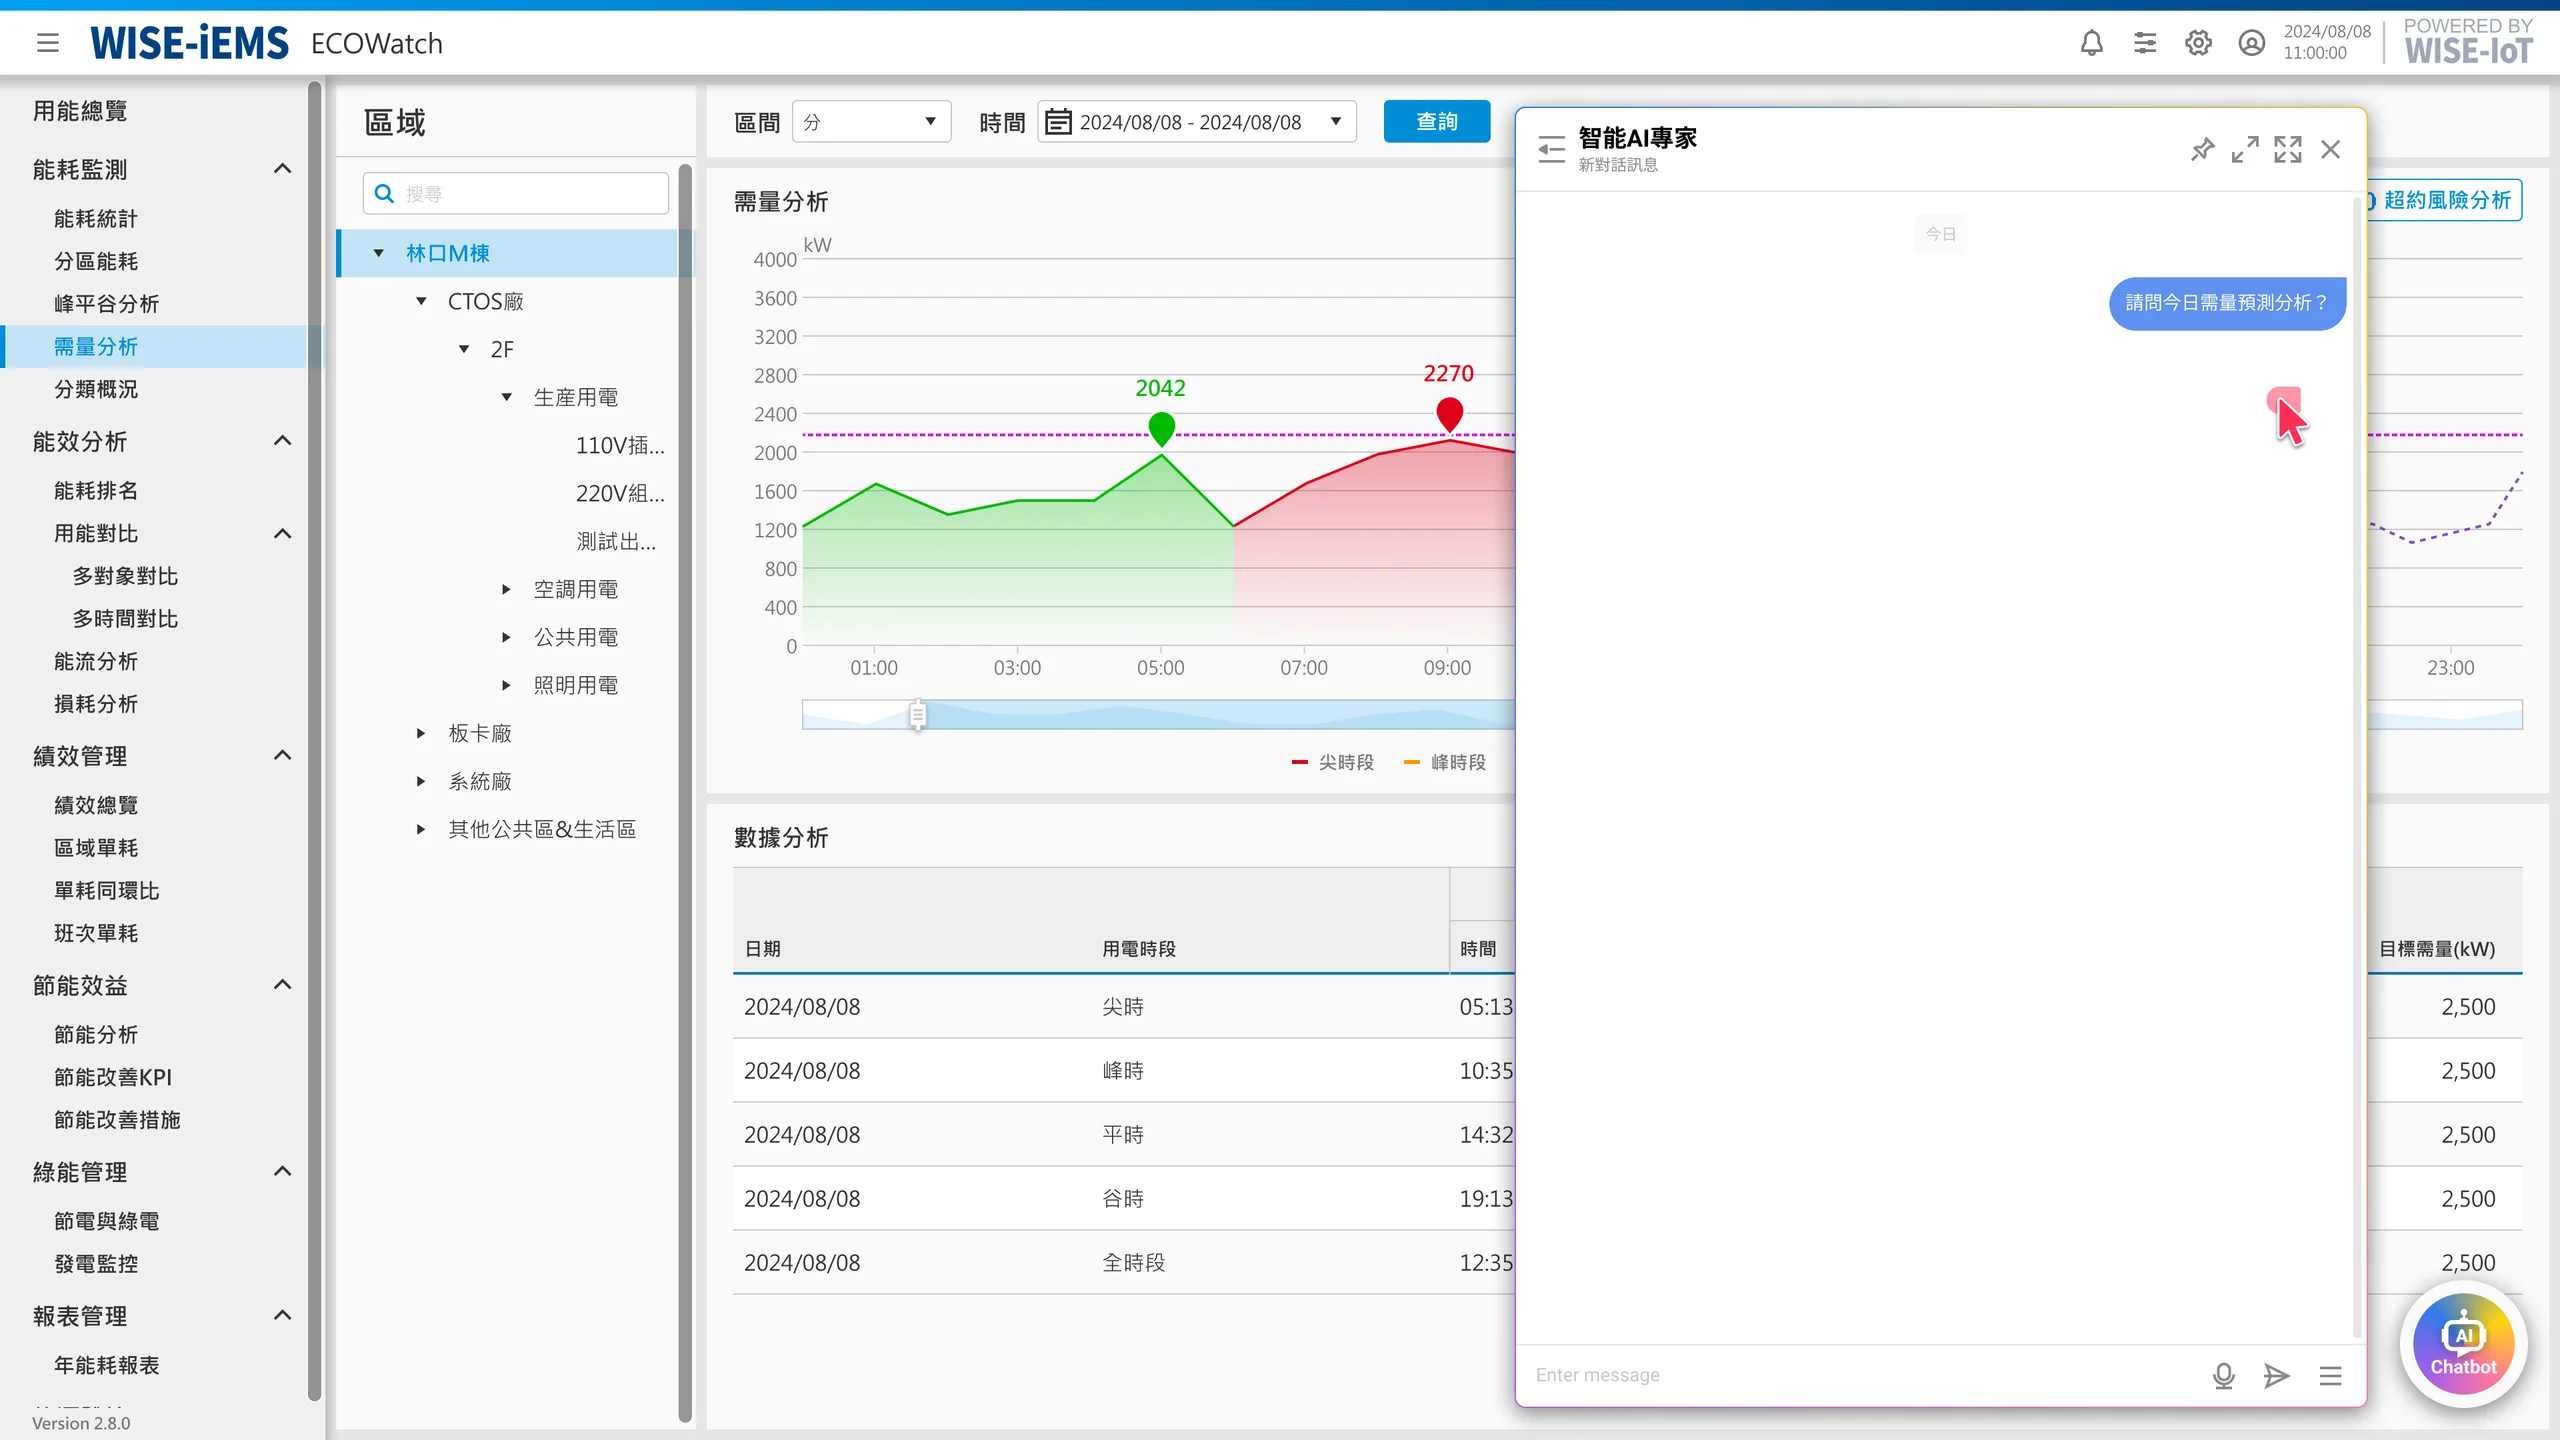
Click the ‘Overage Alert’ button
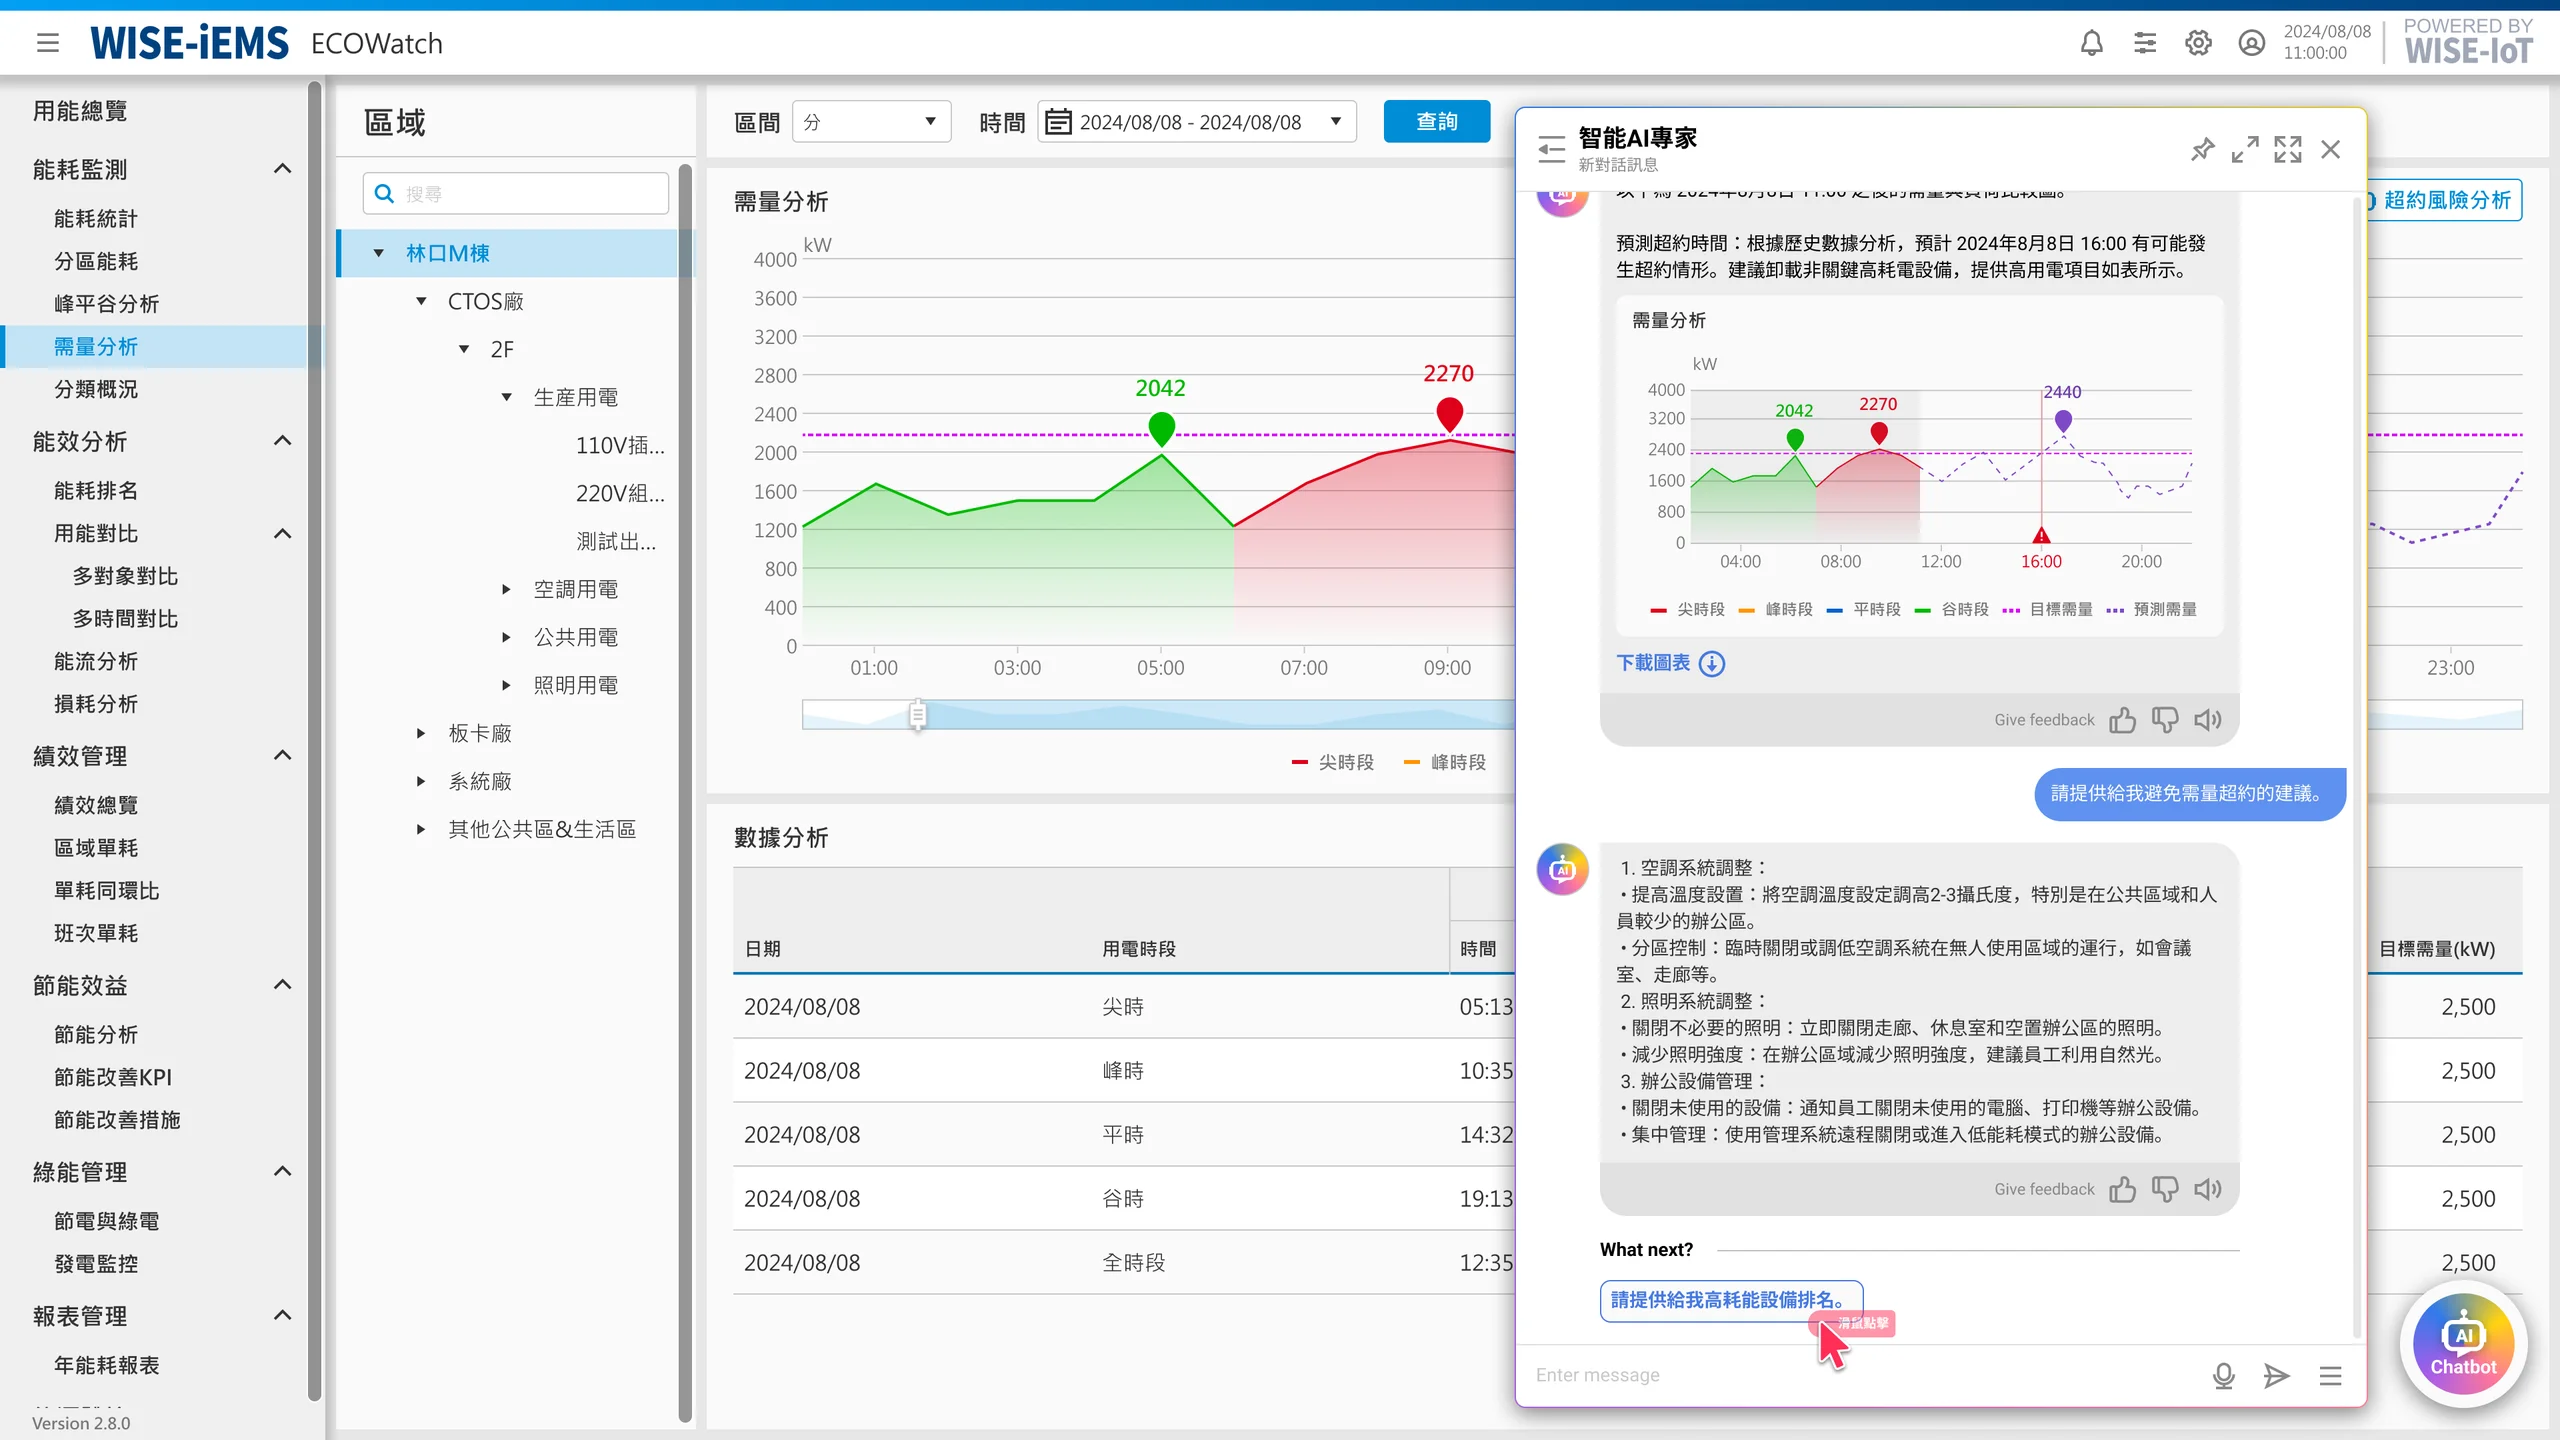
Opens the AI chatbot and automatically asks: What is today's demand forecast?
The chatbot retrieves relevant database information and uses an LLM response framework to provide demand analysis and line charts, with suggested questions for deeper exploration.
Selecting the request for overage-prevention advice sends a new prompt. The chatbot retrieves relevant data and returns a structured response.
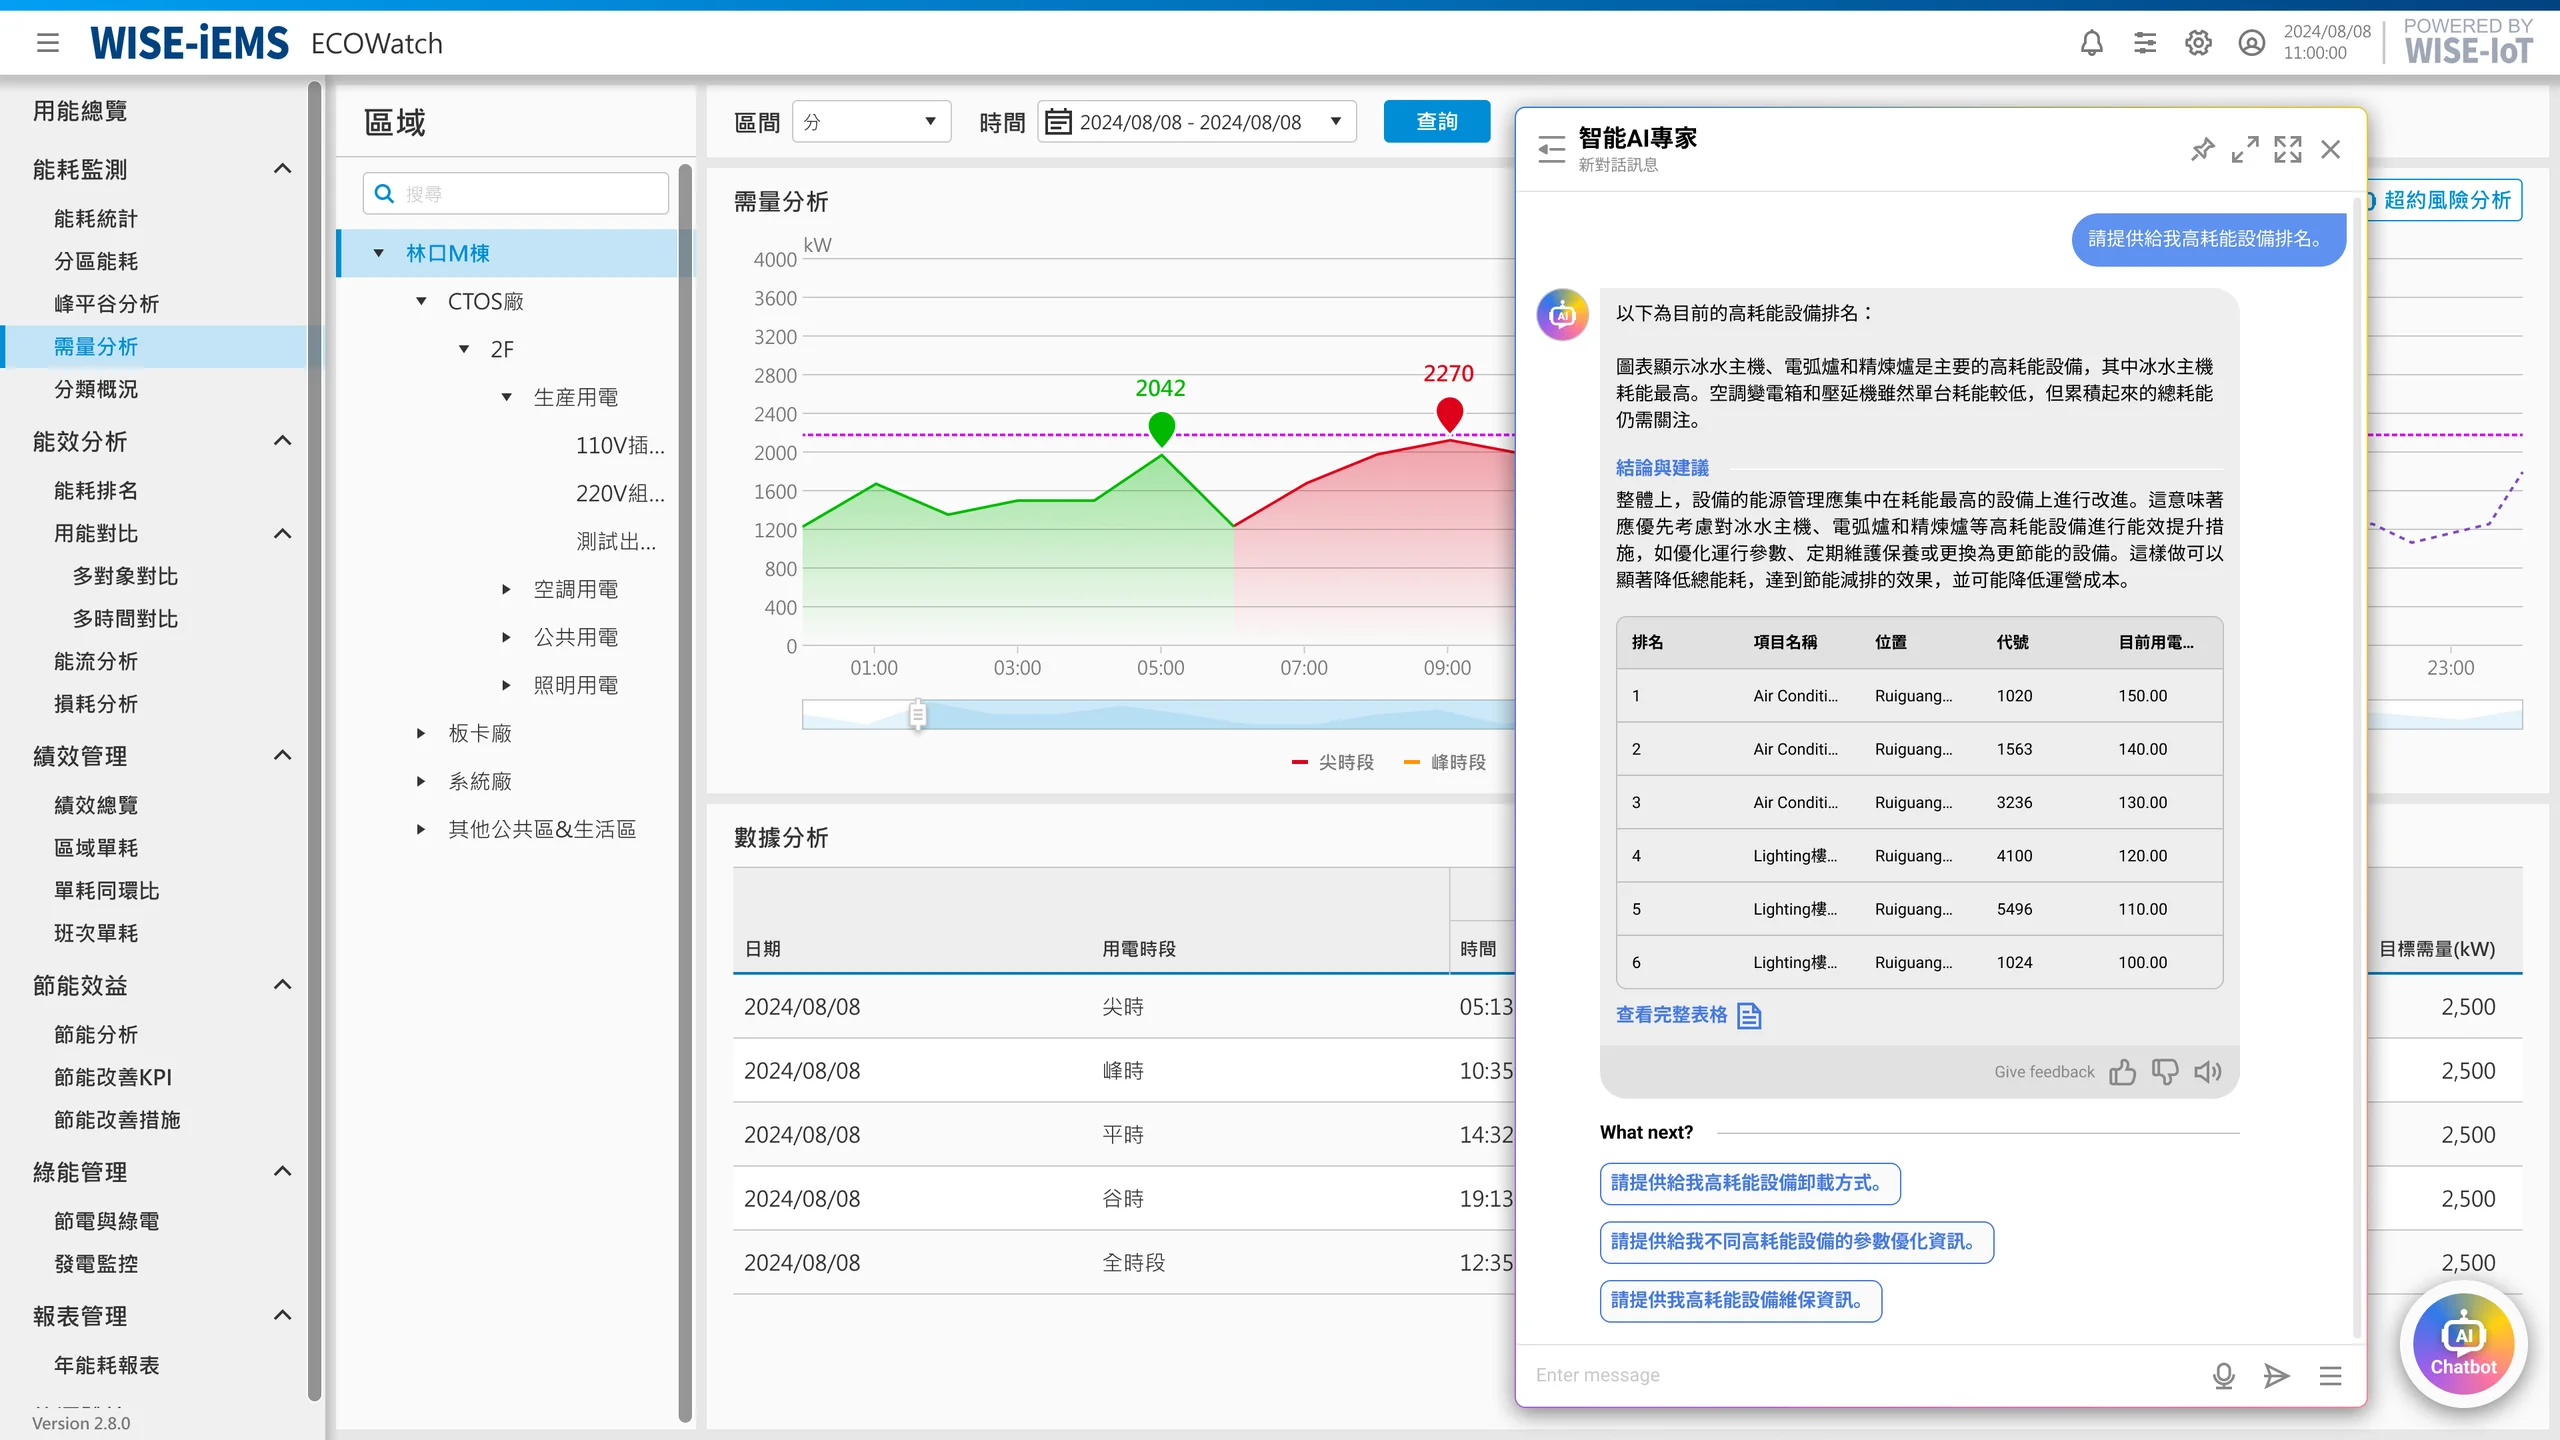
Selecting the high-energy equipment ranking prompt asks the chatbot to retrieve relevant data and chart the equipment most in need of improvement.
Feature 1.2 | Proactive Alerts
The system forecasts risk in the background and communicates severity levels, helping decision-makers respond quickly.
Overage-risk Analysis
Marks forecast peaks, overage-risk intervals, and AI explanations on the demand curve so users quickly understand when issues may occur.
Proactive Notifications
When real-time forecasts indicate an overage, system notifications communicate the risk and recommended actions.
Click the notification button
Alarm Level
Three severity levels:Critical, Moderate, Low
Alarm Level?: Critical
AI Analysis Summary
Summarizes when forecast anomalies will occur and recommends responses.
Trend Forecast Analysis
Provides alarm severity, expected overage timing, and demand-trend analysis.
Top 15% Energy-consuming Equipment
Ranks current electricity use and identifies the names and locations of the top 15% energy-consuming equipment.
Feature 2 | Pattern Recognition
Monitors equipment energy use in real time and analyzes relevant data and events when issues occur, giving facility teams timely maintenance and troubleshooting guidance.
Short-term Anomaly Diagnosis
When equipment behaves abnormally, AI summarizes the issue, identifies likely causes from water-temperature and event data, and references troubleshooting manuals.
Proactive Notifications
When equipment energy use is abnormal, system notifications communicate risk and recommended actions.
Click the notification button
Alarm Level
Three severity levels:Critical, Moderate, Low
Alarm Level?: Critical
AI Analysis Summary
Extracts key information such as anomaly points, equipment status, and recommended responses for equipment managers.
Historical Operating Status
Explains anomaly events in detail and charts one month of chilled- and cooling-water inlet and outlet temperatures, marking when problems occurred.
Event Analysis
Lists detailed historical events, including event category, expected impact, and occurrence time.
Recommended Troubleshooting
AI combines maintenance manuals with actual anomaly records to summarize fault codes, identify likely causes, and recommend resolutions.
UI Video Walkthroughs
The UI videos demonstrate the complete flow for both features, from triggering alerts and reviewing chart analysis to receiving recommendations and taking follow-up action.
Demand-overage Alert Flow
Pattern-recognition Flow
NEXT STEPS
Engineering and AI Implementation
After the UI/UX phase, the project moves into engineering implementation and continuous AI optimization. Designers defined chatbot scenarios, interaction flows, and interface experiences; backend engineers will build the AI database, improve model capabilities, and turn these scenarios into an operational system architecture.
01
Building a RAG Knowledge-base Architecture
Combine Azure OpenAI with a local Llama model to create a low-latency, accurate pipeline while protecting facility data. LangChain will package the pipeline and optimize chunking and vector retrieval, enabling more accurate responses for facility management, maintenance, and energy analysis through an internal knowledge API.
Azure OpenAILlamaLangChainRAGVector DB
02
Peak-shaving Forecasting and Automated Coordination
Connect AI forecasting models to multi-site monitoring so the system can continuously analyze daily load curves and automate threshold alerts. When peaks or overage risks are predicted, early alerts support real-time load shifting and preventive energy control.
AI Forecasting ModelAutomated AlertsMulti-site MonitoringLoad Analysis
Vision for an Intelligent Workflow Platform
Ultimately, we expect this AI system to grow from a better-answering chatbot into an intelligent workflow platform for facility-management decisions. As the AI database becomes more complete and the model's judgment improves, it will help users read data faster, anticipate risk, and get actionable guidance.
REFLECTIONS
From designing AI features to defining decision-making, validation, and trust.
01
Establish the Decision-maker Before Showing What AI Can Do
The midterm review showed me that complete functionality does not guarantee a clear value proposition. For audiences unfamiliar with energy-management systems, I first need to establish the role, context, and decision barrier, then connect each pain point directly to the relevant interface.
02
Bring the Judgment to Users — No Need to Ask the AI First
After the research, I realized we could not expect facility staff to open the chatbot every time and know how to phrase the right question. I changed the approach so the system surfaces analysis at the right moment—for example, directly within existing charts or through notifications—then lets users ask follow-up questions when needed.
03
Turn Domain Rules into Testable Interface and Data Assumptions
Faced with complex demand-pricing rules, I first worked with the product, data, and engineering teams to confirm how often the data updates, what counts as an overage, and how the system should identify high-consumption equipment. Once the rules were clear, I could determine which information the interface could show directly and where it should avoid overpromising.
04
AI Trust Comes from Controlled Boundaries and Expert Feedback
Energy management cannot simply trust AI answers because they sound reasonable. The engineering team first limited the questions the system could answer and the data it could use, positioning the output as decision support rather than allowing it to decide for people. On-site staff can also record how an issue was ultimately handled, turning those experiences into evidence for future analysis.